In the modern world, many countries have lotteries, and every week many millions of people participate in the hope of acquiring a substantial fortune. The most enthusiastic players tend to play at least on a weekly basis, and that might represent a relevant percentage of their income. That raises a question of how much money people actually spend in their life on the lottery, and statistics can help us determine a number close to reality throughout the world.
Contents
- First Statistics – Total Revenue & Lottery Demography
- Money Spent on Lotteries in the USA
- State-by-State Lottery Expenditure Per Capita From 2016 to 2018
- Lottery Expenditure in the U.K.:
- Lottery Revenue and Behavior in India
- Lottery Numbers in Germany
- Lottery Expenditure in Spain
- Italy
- How much would you spend on a holiday if you won a lottery prize of 10,000 euros?
- Summary
- Resources
First Statistics – Total Revenue & Lottery Demography
Lotteries are widely spread in the United States, yet there is relatively little empirical research on the extent of gambling on the lottery in representative sociodemographic groups characterized by age, gender, race/ethnicity, and socioeconomic factors. Data from the U.S. Census Bureau’s 2008 Annual Survey of State Government Finances showed that state lotteries were a significant source of revenue for 42 states and the District of Columbia, with only eight states having no state-administered lottery in 2008. To give an idea of its extent, the total state lottery ticket sales in the United States were $77.3 billion.
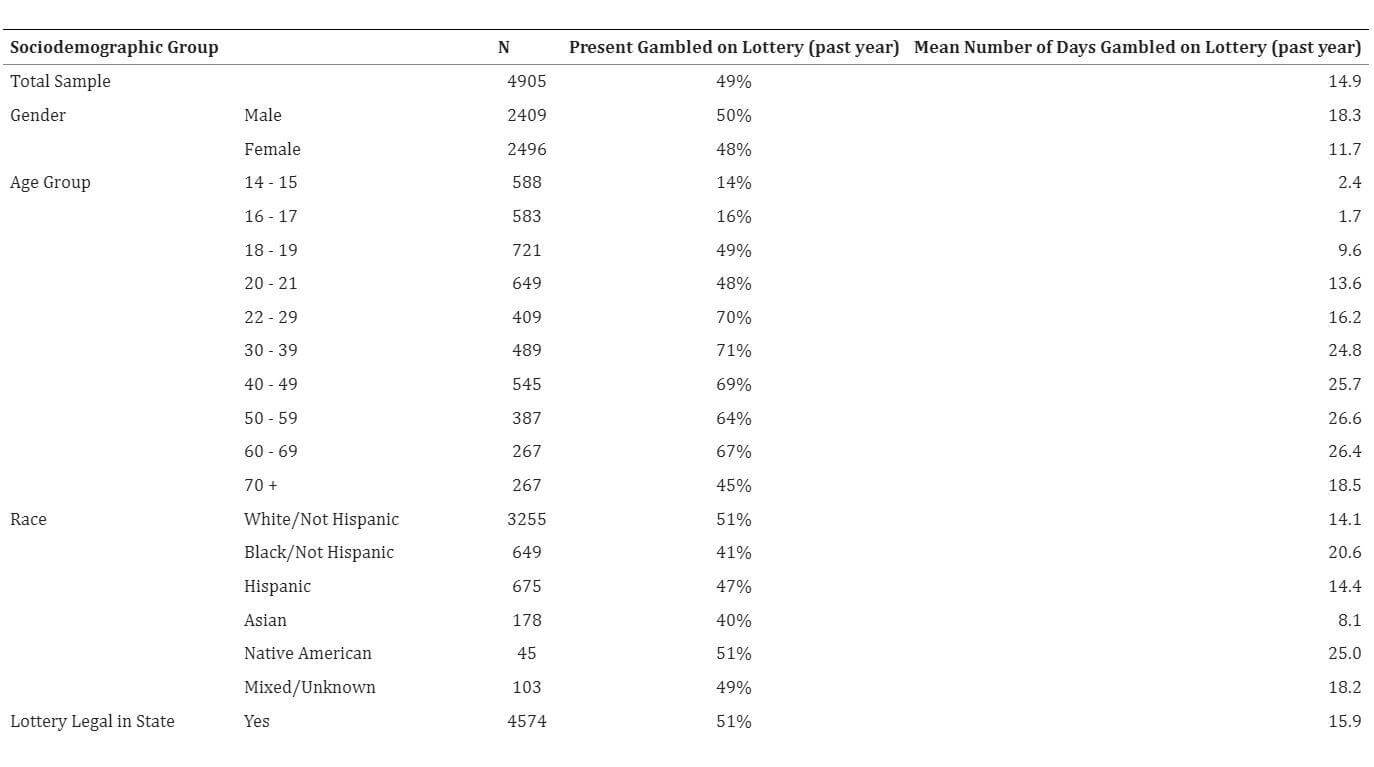
Percent gambled on the lottery (past year) and the average number of days gambled on the lottery (past year) using the combined youth and adult gambling surveys (N = 4,905)
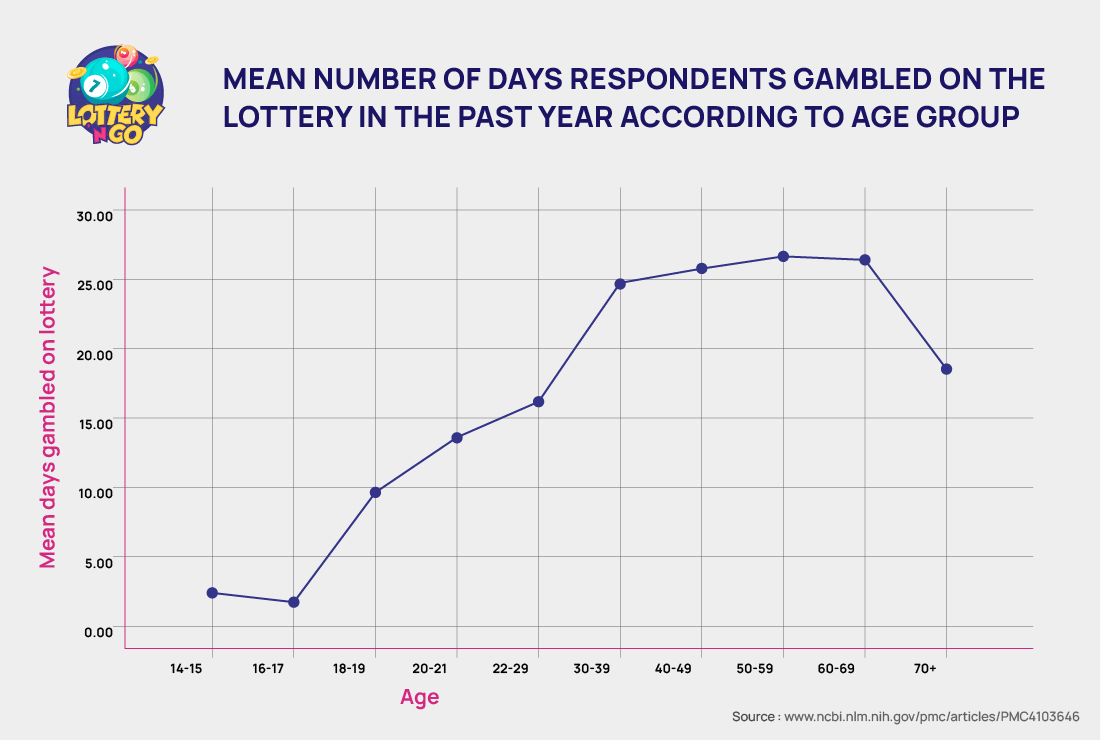
According to the source, men gambled on the lottery more than women (18.3 days in the past year for males versus 11.7 days for females). The percentage of gambling on the lottery was relatively low among adolescents in the 14 – 15 and 16 – 17 age groups (14% and 16%, respectively) and then was markedly higher for young adults of 18 to 21, with approximately half of these young adults having gambled on the lottery in the past year. The proportion of gambling on the lottery reached the highest among those in the 22 to 29 age group (70%) and respondents in their thirties (71%). Approximately two-thirds of adults in their forties, fifties, and sixties gambled on the lottery, with the percentage falling below half (45%) for those over 70 years old. The age pattern for the amount of lottery gambling can be observed in the below figure where the mean number of days gambled in the past year is plotted for the same age groups as in the table.
Regarding the lottery activity for respondents of various racial/ethnic groups, non-Hispanic whites and Native Americans had the highest proportion of gambling on the lottery (51% for each group); however, in terms of mean levels of gambling on the lottery, blacks, and Native Americans had the highest averages (20.6 days and 25 days, respectively). Asian respondents had the lowest mean levels of lottery play, with an average of 8.1 days.
Whether or not the lottery is legal in the state where a respondent lives is related to the percentage of gambling on the lottery.
About 51% of respondents gambled when they lived in states where the lottery was legal, compared to a rate of 18% gambling on the lottery when they lived in a state where the lottery was not legal. Likewise, the mean number of days one gambled on the lottery was related to the legality of the State (15.9 days in lottery-legal states versus 1.9 days in states where the lottery was not legal).
Respondent’s socioeconomic status was related to gambling, with those in the lowest fifth SES group having the highest rate of lottery gambling (61%) and the highest mean level of days gambled in the past year (26.1 days). There were few observed differences in lottery gambling for those in the three upper SES groups – 42% to 43% gambled on the lottery. In the past year, the three upper groups averaged ten days of gambling on the lottery. Although neighborhood disadvantage was based on objective census data, the variable was similar to socioeconomic status in its relationship to lottery play. Those respondents who lived in the geographic area with the highest neighborhood disadvantage had the highest number of days gambling on the lottery (19.6).
The present study examined the sociodemographic correlates of gambling on the lottery in a combined dataset of two national gambling surveys among respondents 14 to 94 years old. Lottery play is a popular form of entertainment among adults, with most of those in their twenties through sixties reporting that they had gambled on the lottery in the past year. It is also clear that in states where the lottery is legal, there is eight times the mean number of days gambled on the lottery.
 Money Spent on Lotteries in the USA
 Money Spent on Lotteries in the USA
In the United States, the lottery is one of the easiest ways to achieve the American Dream; for a few bucks, you may become a multi-millionaire in minutes. However, the best lotteries also count with challenging odds, and the money spent on lottery tickets may soon add up. LendEDU has spent the last three years analyzing U.S. Census Bureau statistics on yearly lottery spending by a state to determine how much the typical American spends and each state’s lottery expenditure per population.
According to a Bankrate poll, 28 percent of Americans earning less than $30,000 a year play the lottery at least once a week. They spend $412 on tickets each year. Restaurant meals and prepared drinks, such as coffee and smoothies, are also common expenses for low-income Americans. Just for the sake of comparison with lottery tickets, these things account for $2,118, or 13% of their annual income, according to Bankrate.
On the other hand, people with a higher income presumably discovered new ways to spend their money. According to an August study of 1,000 Americans aged 18 and older, households earning $75,000 or more spent $105 per year on lottery tickets, a fourth of what low-income households paid.
According to Bankrate, people of all income levels continue to spend money on restaurants and takeaway meals, with 38% engaging in this expenditure at least three times weekly. Therefore, considerably higher than the total spent on the lottery.
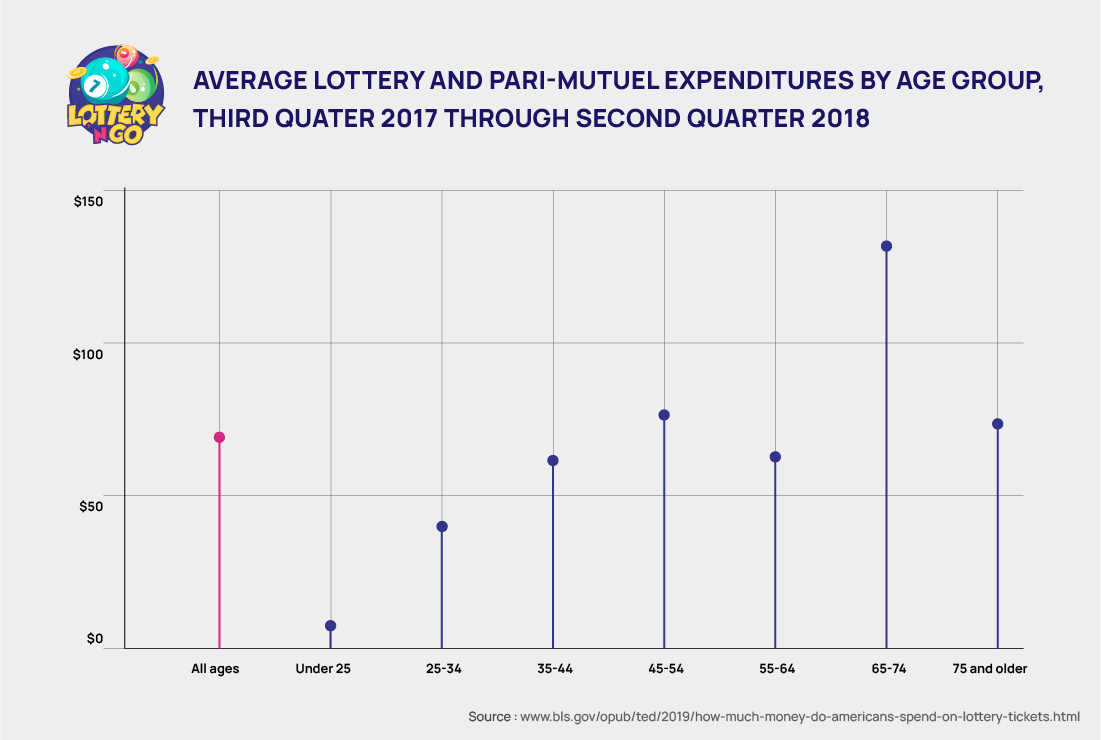
We all like the excitement of the possibility of winning large, but who pays the most for that chance? From the third quarter of 2017 to the second quarter of 2018, those aged 65 to 74 spent the most on lottery tickets and pari-mutuels (betting pools), paying an average of $132.43. This is nearly double, if not more, than the amount spent by any of the other age groups.
| Age group | Average expenditures |
|---|---|
| All ages | 69.52$ |
| Under 25 years | 7.55$ |
| 25-34 years | 40.32$ |
| 35-44 years | 62.08 $ |
| 45-54 years | 77.04$ |
| 55-64 years | 63.20$ |
| 65-74 years | 132.43$ |
| 75 years and older | 74.29 |
Source: bls.gov
Table: Estimated lottery & pari-mutuel spending by age group from the third quarter of 2017 to the second quarter of 2018
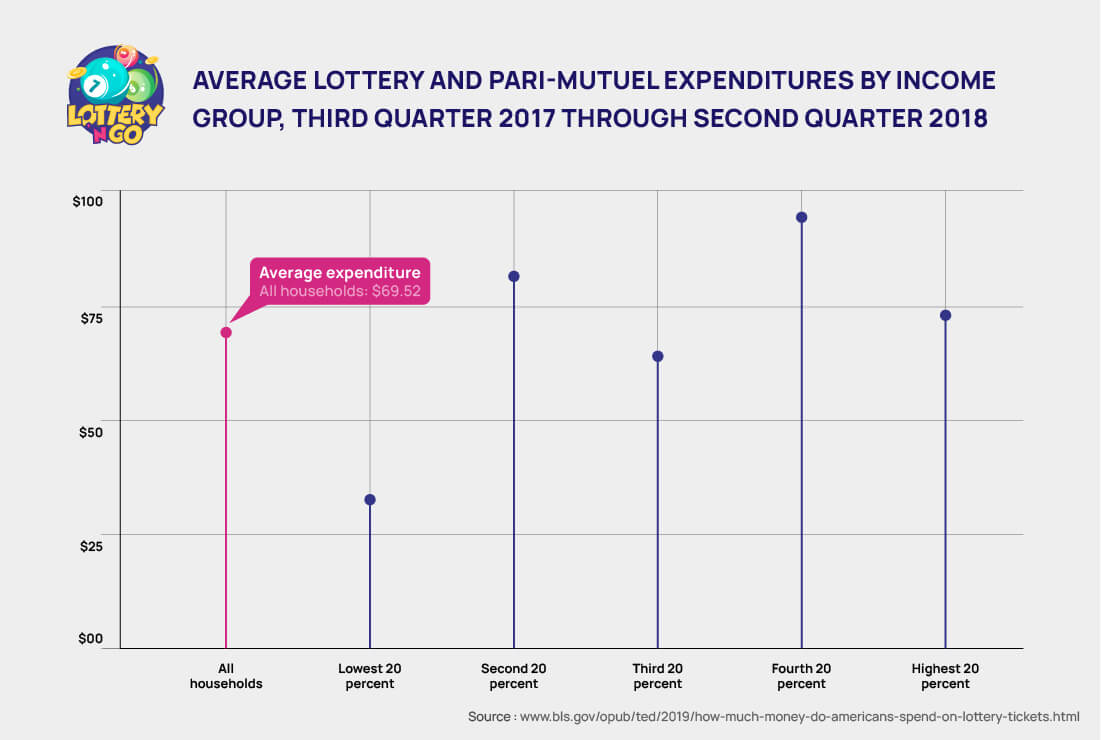
Homeowners with earnings in the bottom 20% spent the most on lottery tickets & pooled betting, spending an average of $94.72 between the third and second quarters of 2017, corresponding to $69.52 for all households. The next highest spenders were households with incomes in the bottom 20%, who spent an average of $81.98.
| Income group | Average expenditures |
|---|---|
| All households | 69.52$ |
| Lowest 20 percent | 32.94$ |
| Second 20 percent | 81.98$ |
| Third 20 percent | 64.55$ |
| Fourth 20 percent | 94.72$ |
| Highest 20 percent | 73.37$ |
Source: bls.gov
Table: Average lottery and pari-mutuel expenditures by income group, third quarter 2017 through second quarter 2018
These figures originate from the Consumer Expenditure Surveys and show how much people spent on lottery tickets and pari-mutuels, but it is important to consider what a household means. Families, single people living alone or sharing a household with financially independent individuals, and two or more people living together who share expenditures are all examples of households or consumer units.
State-by-State Lottery Expenditure Per Capita From 2016 to 2018
Below, you can see how each state’s lottery expenditure per capita evolved from 2016-18 based on lottery revenue and population.
Top 14 states:
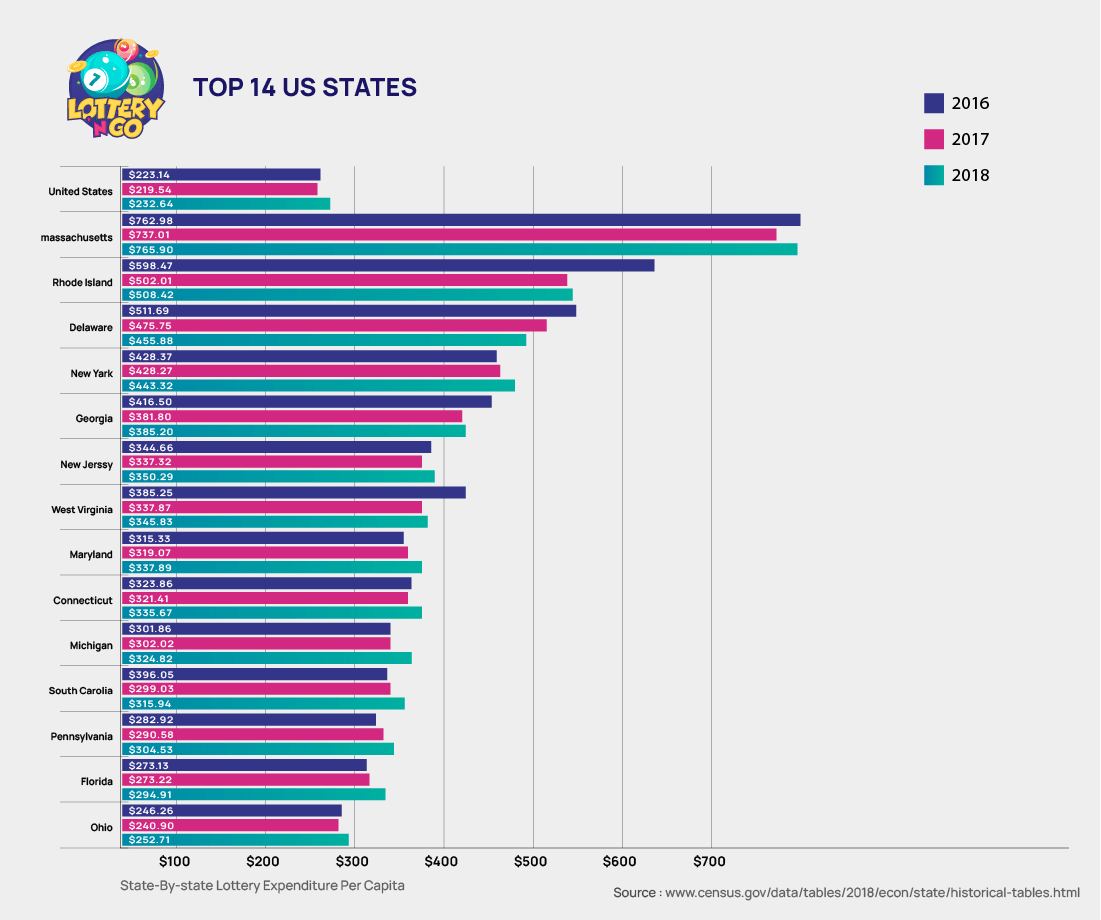
According to it, each state’s 2018 lottery spending per capita to its median household income determines how much money is spent on lottery tickets each year.
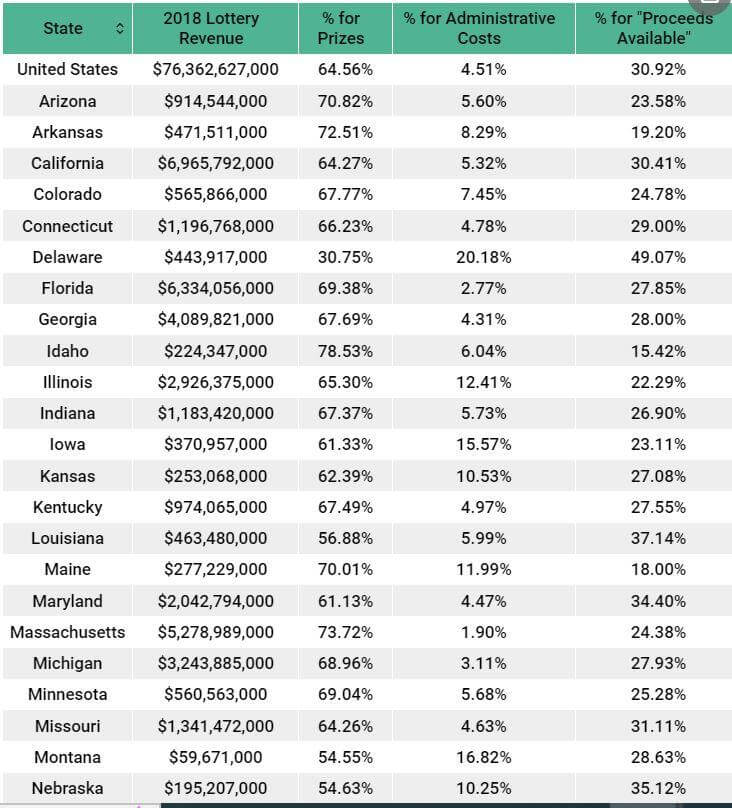
West Virginia spent the largest proportion of their average family income on lottery tickets in 2018, at 0.96 percent. On the other hand, North Dakota spent only 0.05 percent of its median family income on lottery tickets, the lowest in the country. The table below helps us understand how much money is made from lotteries in each state.
Source & References
The United States Census Bureau provided all lottery statistics used in this research. We used information from the 2018 Annual Survey of State Government Finance Tables, which was updated on January 31, 2020. We specifically used the data provided under the heading “Income and Apportionment of State-Administered Lottery Funds: 2018.” This report revealed the lottery revenue in 2018 and how it was distributed in each state.
The second data source was the United States Census Bureau’s State Population Totals annual Components of Change: 2010 – 2019, which was used to calculate population statistics for each state and country. We utilized data from the label “Annual Estimates of Resident Population Change for the United States, Regions and Puerto Rico: April 1, 2010, to July 1, 2019.” This is the latest population statistics from the United States Census Bureau, and it was last updated on December 30, 2019. The yearly lottery spending per capita was calculated by dividing each state’s lottery revenue by the same state’s population in 2019. The prior year’s lottery expenditure per capita numbers was carried over from previous reports.
Lottery Expenditure in the U.K.:
 Lottery Expenditure in the U.K.:
In the evaluated period, 47% of British people had gambled, a tiny increase over the previous year, when 46% of British people bet in the same period. Men gamble more than women, with about half of men (51 percent) playing it in the past four weeks compared to only four in ten women (41 percent ). 20% of all Britons claim they bet at least twice a week.
| Years | Participation in the UK | Male | Female |
|---|---|---|---|
| 2015 | 44.8% | 49.1% | 40.7% |
| 2016 | 44.4% | 52.6% | 44.3% |
| 2017 | 44.4% | 48.4% | 41.4% |
| 2018 | 45.8% | 50.8% | 40.9% |
According to the Lottery Commission, an industry regulator, around £14.5 billion was spent on the lottery in the United Kingdom between October 2017 and September 2018.
This statistic encompasses everything from National Lottery tickets & bingo games to horse racing and sports betting.
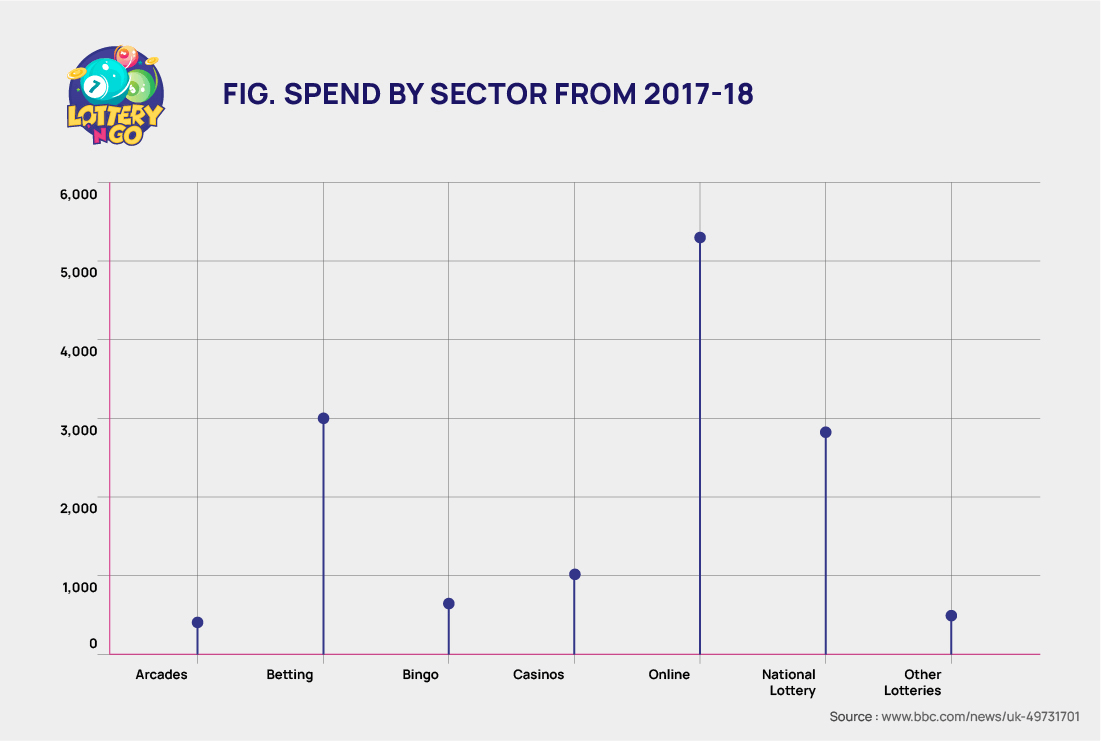
Fig. spend by sector from 2017-18
With £5.6 billion in revenue, online gaming accounted for 38.8 percent of overall spending. Following that, consumer bets in betting shops produce £3.2 billion. During the same period, a little under £3 billion was spent on National Lottery tickets.
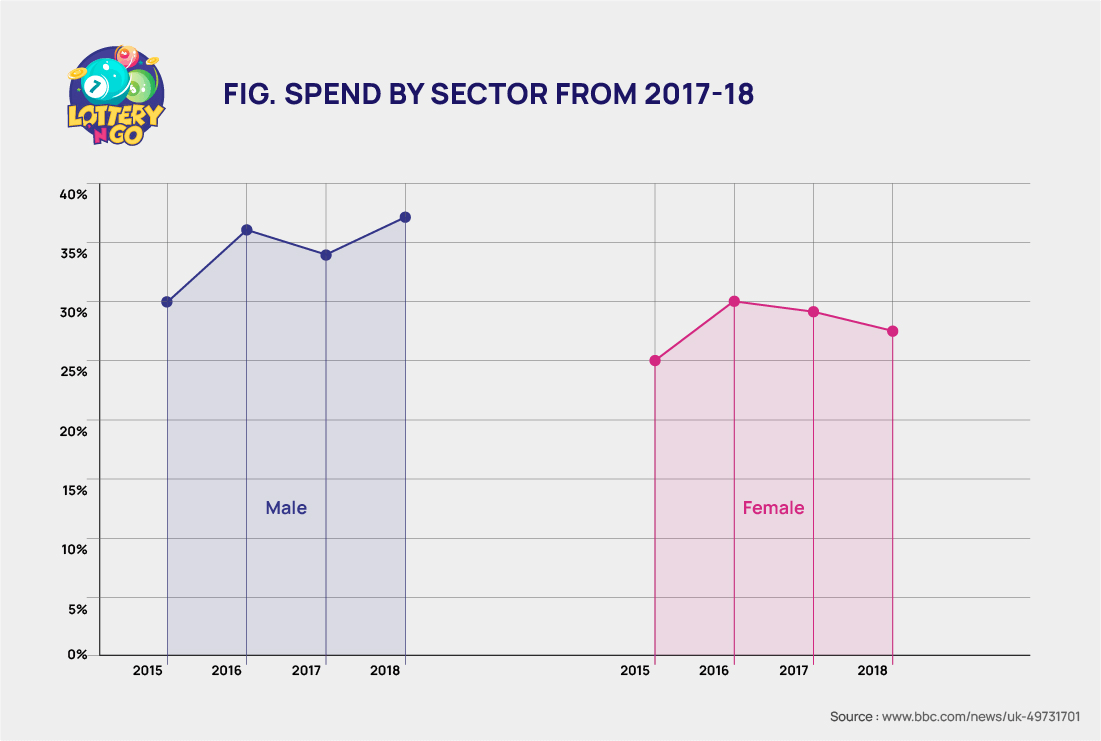
Data from 2015-2018
Those aged 25-34 are the most likely to play the lottery, with 40% participating in at least one variation of gambling in the previous month.
In December 2018, 37 percent of men were questioned in a lottery, compared to 28 percent of women. Men participate at a higher rate as well. Almost one in every five respondents polled by the Gambling Commission indicated they had played a lottery online in the previous four weeks. Most games and bets were carried out via a mobile phone or laptop at home.
Lottery Revenue and Behavior in India

Lotteries have long been popular in the Indian subcontinent, and their popularity grew exponentially with the advent of print and digital media. Looking back at the history of lotteries, we find they were utilized as a sort of amusement in ancient times.
Archaeologists discovered evidence of lottery-based games dating back to the Pharaohs of Egypt. In 1530, the first lottery with prize money was conducted in Florence, Italy. Lotteries quickly became popular in England and America in 1569 and 1612, respectively.
The lottery system was introduced in India roughly 4000 years ago, with the dawn of Indian civilization. The greatest Indian epic, Mahabharata, began with a dice game. Aside from dice games, the Indians were also interested in betting on animal and avian battles. There were several gambling establishments where people might congregate and play. Officials were hired to monitor the game and take a share of the king’s winnings.
For starters, the figure related to the local lottery is enormous. The information listed below brings relevant data from that industry:
- The lottery industry is an INR 50,000 crore industry.
- There are close to 40,000 authorized agents selling tickets in Kerala alone
- 70 lakh tickets are in circulation daily in Kerala
These figures indicate the popularity of the lottery in Kerala and all of India. Lotteries have been there since the beginning of civilization, and it is deep-rooted in the minds of the average Indian resident.
Earlier, lotteries and gambling were in their primitive form, such as rolling the dice game. It has undergone many changes and today can be played virtually. One of the websites that allow that possibility, which is the world leader in providing all international lotteries, is called Lottoland. Any Indian, regardless of location, can indulge in these online games and play the world’s biggest lotteries and games.
Kerala and the Lottery
According to Kerala Economic Review, 2018, the increase in non-tax revenue as a share of GSDP in Kerala from 2013-14 is attributed to an increase in gross receipts from lotteries. Revenue from state lotteries climbed from 13.4 percent in 1980-81 to 38.39 percent in 2000-01 — to an all-time high of 80.49% in 2016-17.
According to data from the state lottery directorate, lottery income in the 2018-19 fiscal year was Rs 9,276 crore, up from Rs 8,977 crore in the previous fiscal year. The profit for the previous fiscal year was Rs 1,673 crore. The estimated income for this year is Rs 11,800 crore.
According to reports, Palakkad and Thrissur generate most of the state’s business. According to an official, people from neighboring Tamil Nadu travel to Palakkad every day to buy tickets.
According to Vinod, a lottery merchant, people from all walks of life buy lottery tickets. They may occasionally win small prizes, causing them to bet on their luck daily. “I have government workers who spend Rs 30 or Rs 50 on tickets daily,” he remarked. Many people do not discuss this at home.
Source: bihar-cetbed-lnmu.in
| Lottery spending per adult in Kerala | Rs 30 or Rs 50 on tickets daily |
|---|---|
| Total lottery ticket sales: | Rs 11,800 crore. |
| Prize money awarded | Rs 4.5 billion |
| Median household income: | Rs. 80 billion |
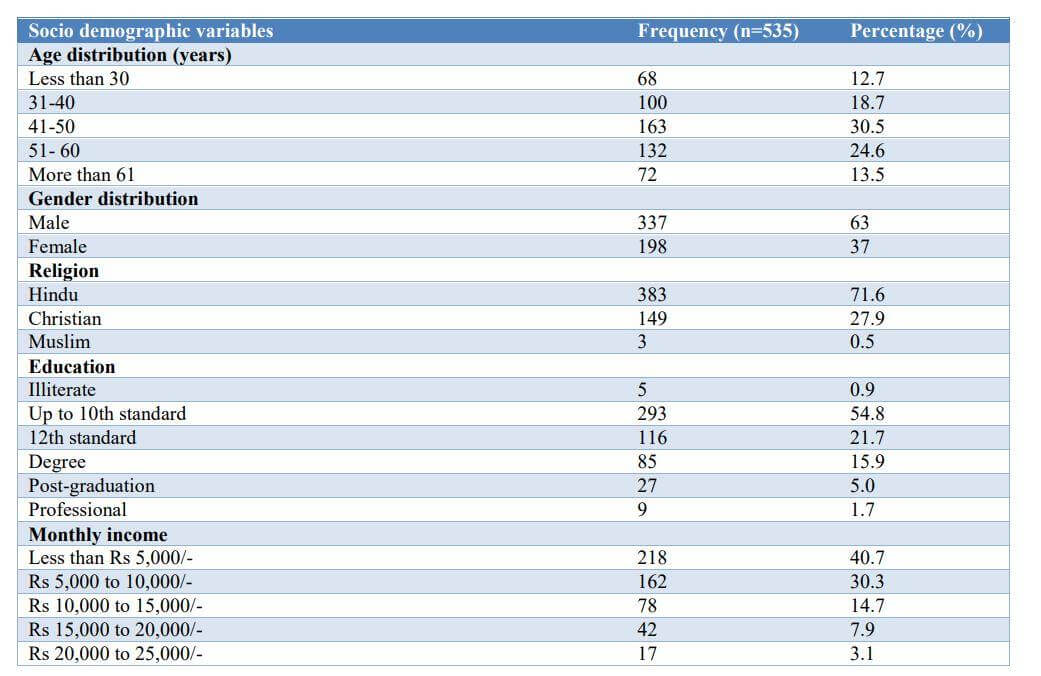
Shows sociodemographic variables in lottery
| Social impact of lockdown in lottery | Number (n=535) | Percentage (%) |
|---|---|---|
| Lost job due to lockdown | 288 | 53.6% |
| Experience any difficulty in finding jobs | 252 | 42.1% |
| Experience any psychological stress | 198 | 32.1% |
| Experience any skipping of at least one of the meals | 195 | 20.3% |
| Domestic violence/crime in your house | 111 | 15.9% |
| Experience difficulty in getting health services | 29 | 0.19% |
Source: DOI
Table: Social impact of lockdown in the lottery in India
Lottery Numbers in Germany
 Lottery Numbers in Germany
According to new data from Germany’s state lottery organization, the Deutscher Lotto- und Totoblock (DLTB), lottery sales in the first half of 2020 increased by 4.2 percent to €3.75 billion.
Lotto 6aus49 was the most popular game from six months to June 30, accounting for €1.78 billion in sales, over half of the total. Meanwhile, Eurojackpot stakes increased by more than 35% to €815 million, with GlücksSpirale expenditure increasing by 5% to €121.6 million.
Jürgen Häfner, current DLTB chair and managing director of Lotto Rheinland-Pfalz, said the good first-half performance demonstrated the popularity of lottery games in Germany, despite the coronavirus (Covid-19) epidemic forcing most lottery sales locations to close temporarily.
He said this disruption was mitigated by loyal players purchasing multi-week tickets or migrating online, while longer jackpot cycles raised interest in – and sales of – Lotto 6aus49 and Eurojackpot.
Häfner stated that around 40% of state lottery money was returned to state governments through taxes and levies, totaling €1.5 billion in the first half.
“That implies over €8.2 million poured into state finances daily,” he added. “That is money without which many things in Germany would be impossible.”
Here is the list of E.U. members participating in the lottery
| 2015 | 2016 | 2017 | 2018 | 2019 | |
|---|---|---|---|---|---|
| E.L. Members in the EU28 | 52 | 53 | 53 | 53 | 51 |
| E.L. Members outside the EU28 | 20 | 20 | 20 | 21 | 20 |
| Total | 72 | 73 | 74 | 74 | 71 |
Source: european-lotteries.org
Table: Number of E.L. Members Participating in the lottery in the 2019 Data Collection Who Provided Data for Individual Years
E.L. Members in the E.U.: Money for Society by Target – 2019 (€M)
| Sports | 34 | 7.5% |
| Other Good Causes | 34 | 14.2% |
| lottery | 45 | 78.3% |
| total | €15,404M |
Source: european-lotteries.org
Table: E.L. Members in the E.U. in the lottery: Money for Society by Target – 2019 (€M)
Lottery Expenditure in Spain
 Lottery Expenditure in Spain
The Spanish are still (and will remain) faithful to the traditional Christmas raffle. In the last year, the average expenditure per citizen touched 67.5 euros, while it has increased to 68.48 euros this year.
According to the consignment data per inhabitant of the State Lotteries and State Betting Society (Selae), this data corresponds to the sales estimates made by Selae when sending tickets to the lottery administrations. However, there is always a proportion of tenths that remain unsold.
The forecasts also state that more than 24 million residents in Spain of legal age will buy shares of El Gordo Christmas, which sold nearly 2,900 million euros in 2018. It follows that 70.2% of residents in Spain between 18 and 75 years of age remember buying the Christmas Lottery, according to the study on Social Perception about gambling in Spain 2018, from the Carlos III University of Madrid.
According to the source, the Spanish spent more than 9 billion euros on the state lottery in 2019. In the same year, they also spent approximately 2.25 billion euros on the ONCE lottery and 34 million euros on the Red Cross-owned lottery.
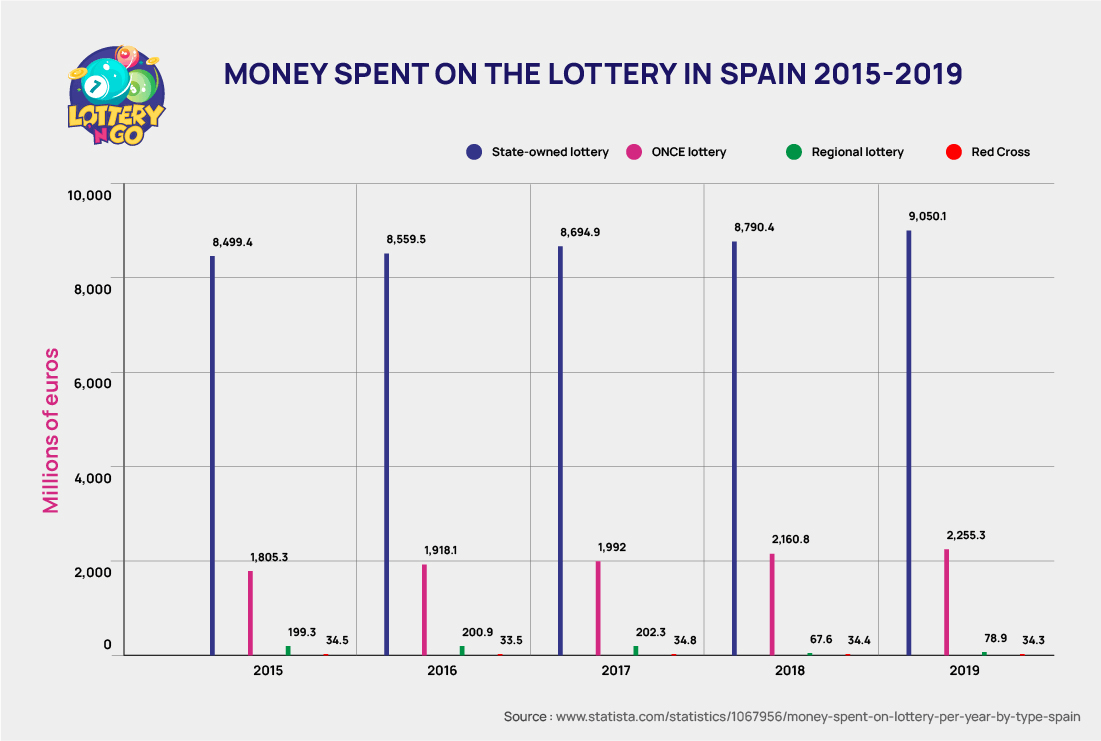
Money spent on the lottery in Spain 2015-2019
Italy
 Italy
ItalyLotteries and gambling, in general, are extremely popular in Italy for a series of reasons, including:
- Culture: Lotto bets are deeply ingrained in the culture of people, especially in the South, where the “Smorfia” (the alleged interpretation of dreams to bet on certain Lotto numbers) was invented. In the South of Italy, it is a habit of many people to bet on certain supposedly “lucky” Lotto numbers weekly. This occurs not only in the South and not only in low-education people.
- Perceived potential shortcut to wealth: lotteries are seen as a way to obtain quick access to wealth, short-circuit the system and finally become rich.
- Extreme advertising: lotto, lotteries, and bets are advertised everywhere: from TV to newspapers, from the radio to the internet. The Italian State almost eradicated the vast illegal betting market that flourished until the 80s by creating legitimate versions of all popular betting games & lotteries.
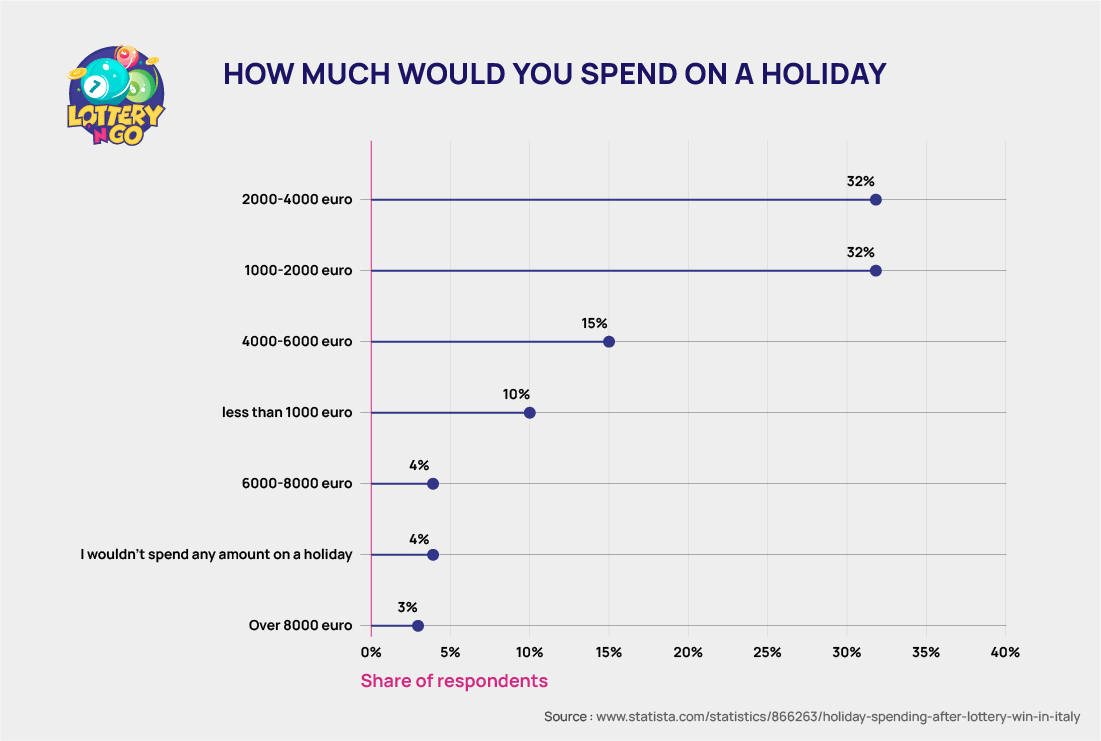
How much would you spend on a holiday if you won a lottery prize of 10,000 euros?
The below fig shows the amount of Italians would spend on a holiday if they won a lottery prize of 10,000 euros, according to a survey made among Italians aged 18 – 65 in 2018. The survey results show that about two-thirds of respondents would spend between 1,000 and 4,000 euros on a holiday if they won a lottery. By contrast, only three percent of respondents stated they would spend over 8,000 euros.
Summary
Considering the shortage of statistics related to how much money people spend on the lottery throughout their lives, the United States proved to be the best source for that information. It has a strong culture of purchasing lotteries, and the data shows that people inserted in the lowest-income groups are more prone to spending more money on lottery tickets.
In numbers, it was proved that 28% of the Americans earning less than $30,000 a year spend about $412 in tickets every year. That is roughly 1.3% of their income. If we consider the lottery to be an entertaining activity and the fact that about 8% is spent on other daily activities such as drinking a cup of coffee, that is not alarming.
From the demographic studies, we could also determine that households earning $75,000 or more in total spend about $105 a year on lottery tickets. An average of $94.72 is spent in the fourth 20% of earnings, against $32.94 in the poorest households. That contradicts the belief that the poorest households invest more in lotteries.
The culture of each state also has a lot to do with how much money people spend on lotteries. Also, men are more prone to spend on lottery tickets, and the age group between 65 and 74 spends the most, namely an average of $132.43.
In general, people do not seem to spend a worrisome part of their income on lotteries, which represents a healthy relationship with gambling – considering the average. It varies greatly from one state to another, and especially between countries in different situations. While the poorest tend to play more when we consider individuals rather than households, the reason is clear: they are eager to have their lives changed by a jackpot.
Resources
- https://www.ncbi.nlm.nih.gov/pmc/articles/PMC4103646/
- https://www.statista.com/statistics/1067956/money-spent-on-lottery-per-year-by-type-spain/.
- https://www.statista.com/statistics/866263/holiday-spending-after-lottery-win-in-italy/.
- https://journals.sagepub.com/doi/10.1177/14695405030032005.
- https://www.bls.gov/
- https://www.cbsnews.com/news/who-buys-lottery-tickets-those-who-can-least-afford-them/
- https://lotteryngo.com/lottery-stats-and-facts/
- https://www.census.gov/data/tables/2018/econ/state/historical-tables.html
- https://www.census.gov/data/tables/2017/econ/state/historical-tables.html
- https://www.businessinsider.com/households-earning-less-than-13000-a-year-spend-9-of-their-income-on-lottery-tickets-2012-3?op=1
- https://www.national-lottery.co.uk/games/set-for-life?icid=-:mm:-:mdg:sfl:dbg:pl:co
- https://www.martinfoundation.com/blog/martin-foundation-an-empire-in-the-making.php
- https://digitalcommons.unf.edu/cgi/viewcontent.cgi?article=1248&context=spinnaker
- https://www.loto.ro/info-loto/Sponsorizari/Activitatea_de_sponsorizare.html
- https://www.statista.com/statistics/1067956/money-spent-on-lottery-per-year-by-type-spain/
")


")